Susanna Cramb & Earl Duncan
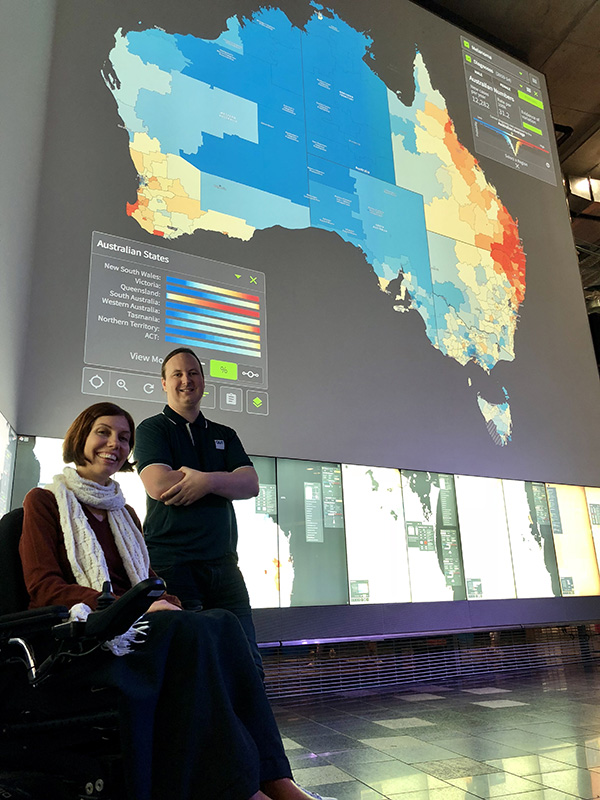
Image courtesy: Jad Goss
In the process of developing this product, many decisions needed to be made. Some of these decisions were statistical and technical in nature, while others related to visual aesthetics. For example, what geographical unit should be used for the small areas, and which areas should be included/excluded? Which cancers should be included and how should the cancer data be aggregated over years? Why is spatial smoothing important and how should it be incorporated into the statistical methods? And how should the results from the statistical models be visualised to best convey the patterns to a scientific and non-expert audience, as well as taking into account encumbrances like colour blindness?
This paper explains the rationale behind each of these decisions. As the Australian Cancer Atlas continues to motivate the creation of similar atlases, this paper sets a useful guide for researchers to follow.
- Link to publication: https://ij-healthgeographics.biomedcentral.com/articles/10.1186/s12942-019-0185-9