Imagine you’re a medical officer in an industrial area charged with determining if pollution is having an impact on the growth of children. You would need to track their development over time, comparing the growth curves to those of similar children elsewhere.
But height typically is recorded only when children visit the doctor—some frequently, some infrequently. At best, there will only be data for segments of individuals’ growth. So how can you compensate for the missing information, particularly when growth patterns vary widely depending on genetic inheritance?
Professor Aurore Delaigle, Chief Investigator at ACEMS and an Australian Research Council Future Fellow, has set out to solve this type of problem.
“We’re trying to fill in data that hasn’t been observed,” she says.
Aurore and her team at The University of Melbourne have devised practical methods that seem to be working well. Now they need to generate a theoretical basis for their technique so it can be generalised for use in a wide range of problems—from assisting automated answering machines to interpret a caller’s speech patterns, to making the most of satellite data that can only be collected intermittently.
challenging_data_aurore_fragments_of_growth_curves_of_children_.jpg
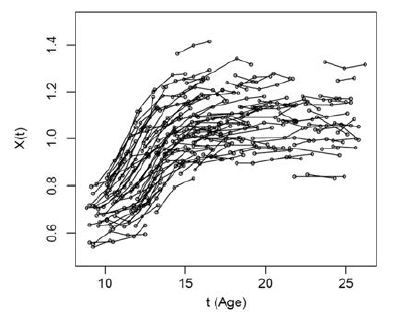
Fragments of growth curves of children. The horizontal axis is age t, and the vertical axis is growth X(t)
“We needed to develop a method, called clustering, that uses only mathematics to compare everyone with everyone else and creates groups of the fragments of growth curves that are most similar to each other, without previously knowing anything about them. Then we can try to uncover the reasons behind why those groups exist,” Aurore says.
ACEMS has financed a postdoctoral fellow to work with Aurore on the problem, allowing her to use the research to motivate her students by using a realistic example of modern statistics.
“We have meetings and brainstorming sessions,” Aurore says.
Now, Aurore needs data and further problems to extend the work. The original fragmentary growth curves on which she and her team have been working, while taken from a real-life situation, were published online as part of a statistics text. Aurore and her team are currently trying to find medical colleagues with access to other datasets that could be used to fine-tune and test her methods.