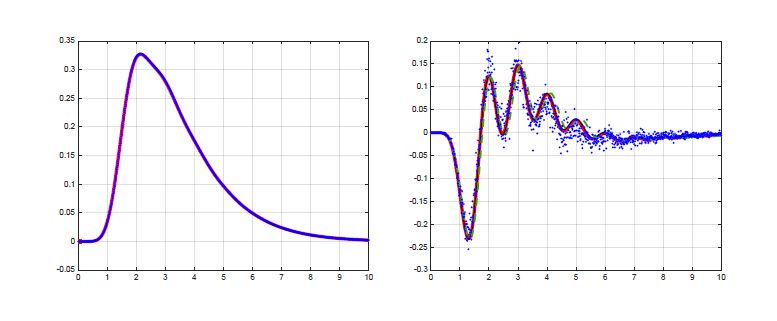
The first graph compares data to random matrix predictions. The statistical accuracy of the data set is so great that a structured difference can be extracted in the second graph. This difference also agrees with random matrix predictions.
The first graph compares data to random matrix predictions. The statistical accuracy of the data set is so great that a structured difference can be extracted in the second graph. This difference also agrees with random matrix predictions.