From nearly 17,000 measurements of coral position and growth on a reef in French Polynesia, an international research team teased out which reef-building species were most sensitive to attack from crown-of-thorns starfish and destruction during tropical cyclones, and what times of their life history.

uts_ci-professor_matt_wand.jpg
Prof Matt Wand
The information is of significance to Australia since, according to AIMS (a partner organisation of ACEMS), cyclones and crown-of-thorns starfish are also the biggest threats to the Great Barrier Reef. But it wouldn’t have been possible without using statistical methods for handling large amounts of data devised by Professor Matt Wand, one of the paper’s authors and a chief investigator at ACEMS.
In an era of credit cards, Facebook, the internet, geographical positioning systems, and growing numbers of electronic sensors in medicine, biology and the physical sciences, data keeps flooding in, Matt says.
“We need to develop methodologies ready to confront bigger and bigger data sets and models that have more and more parameters.”
And that’s just what Matt, who is Distinguished Professor of Statistics at the University of Technology Sydney, has been doing. The results of his efforts have been so significant that they will be published in the March 2017 issue of the Journal of the American Statistical Association as one of the few selected discussion papers, a rare honour for someone from outside the USA. In the journal, the work is discussed by six experts in the field.
CLICK HERE TO READ PROF MATT WAND'S PAPER IN THE JOURNAL OF THE AMERICAN STATISTICAL ASSOCIATION
“The paper lays down a framework that makes it easier to implement models to extract useful information from large data sets, but which also allows you to extend these models to more complicated versions in future.”
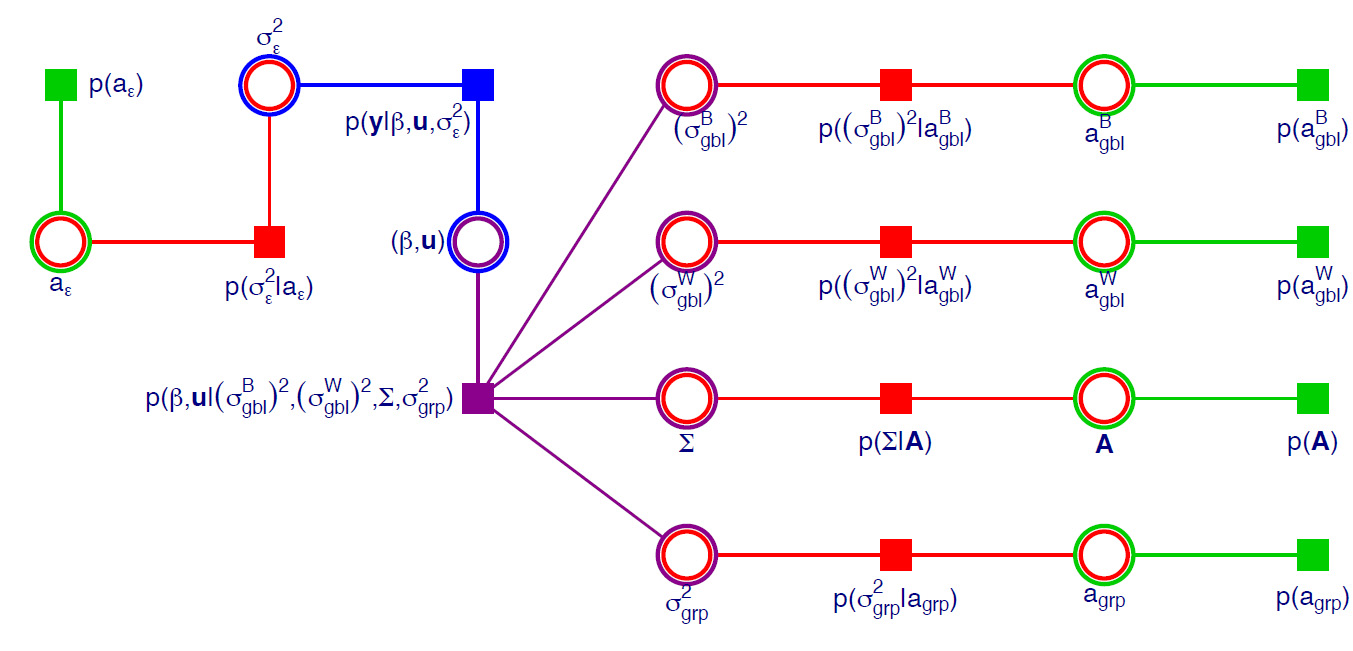
matt-wand-figure.jpg
A factor graph for a group-specific curve semiparametric regression model.
“It’s an iterative process. Each time a message is passed you get closer and closer to the optimal solution,” Matt says.
And for more complex models, he says, you can build on formulae that have already been derived for simpler models. To move from fitting a straight line to the data to a more sophisticated curve, for instance, you don’t need to go back to square one and revisit the maths that gave you the straight line—you can just add to it. In other words, the technique is future-ready. You can elaborate on what you have today to efficiently produce a more complicated model to accommodate tomorrow.
“It’s like drilling a series of different-sized holes. You don’t have to go back to the hardware store to buy a different drill each time. All you need is a new drill bit,” Matt says.
“There are two advantages of the work. It provides a faster way to usefully analyse what the data means. Often we can get it down to less than a second on ordinary laptop computers. And it gives you a way of going beyond today’s models. You don’t have to go back and do all the algebra and coding from scratch. You only have to figure out a few new message types and program them.”
ACEMS supported this development and helped facilitate Matt’s collaborations, to discuss ideas and elements of his methodologies with his colleagues. Other colleagues have contributed data on which to work, such as the information on the coral in French Polynesia, and 80,000 measurements of the growth of babies in Africa for an ongoing project on the impact of the environment on their development.